Download this report
Lately, there has been a lot of talk – and action – about reducing federal spending and the federal workforce. As nonprofits, we are feeling the impact of these reductions. We know on an individual organization basis the programs that can’t move forward and the workers that may be laid off due to these cuts.
The most frequent question/concern we’ve fielded in 2025 is understanding the broader impacts to Montana of possible cuts to federal funding. Through a partnership with Montana funders and Headwaters Economics, MNA is proud publish its latest white paper, Potential Impacts of Federal Cuts to Montanans & Montana’s Economy, detailing all federal funding that moves into Montana and where it goes.
While there is still so much uncertainty about what will happen, this report helps us better understand and communicate what is at stake when federal spending and the federal workforce is reduced.
Federal funding in Montana
Federal funding is a cornerstone of Montana’s economy, contributing over $14.1 billion in obligated funds in FY 2024 to state and local governments, utilities, businesses, schools, and individuals.[i] Federal grants account for 43% of the state government’s total annual revenue ($4.32 billion) – a larger share than the national average.[ii] For every dollar Montana contributes in federal taxes, the state receives $1.40 in return,[iii] supporting essential services such as education, housing, healthcare, highways, and infrastructure.Local governments depend on federal funding and federal “pass-through” grants to states for critical projects, including roads, airports, and disaster response. Additionally, nonprofits provide essential services and programs to communities through grants and contracts with the federal government. Reductions in federal funding could strain state and local budgets, jeopardize jobs, and disrupt vital public services that communities rely on.[iv]This report examines the potential effects of federal funding and employment cuts, focusing on impacts to Montana’s nonprofit sector, workforce, and overall economic stability.
Impacts to Montana’s Nonprofit Sector
Montana’s nonprofit sector is the state’s third largest employer, accounting for 11.8% of jobs (60,181) and over $3.6 billion in annual wages.[v] The nonprofit sector makes up an even greater share of the economy in many rural counties. In Deer Lodge County, one in five jobs is in the nonprofit sector, while in Valley County, nonprofits account for 23% of total annual wages.[vi]
Government funding plays a crucial role in strengthening Montana’s communities through partnerships with nonprofits. Of the 667 Montana nonprofits that receive local, state, and/or federal government grants, 64% would be financially at risk if they lost their government funds.[vii] Cuts to federal funding would disproportionately impact nonprofits in rural communities,[viii] with nonprofits in Dawson, Pondera, and Hill counties facing the largest budget shortfalls.[ix]
Montana nonprofits have received an average of $134.4 million/year in new obligated federal contracts, grants, awards, and loans over the last four fiscal years.[x] More than half of this funding comes from six federal sub-agencies: the Forest Service, Environmental Protection Agency, Agricultural Marketing Service, Small Business Administration, Substance Abuse and Mental Health Services Administration, and Administration for Children and Families.[xi]
Federal funding is irreplaceable at scale. Nationally, nonprofits receive more than $300 billion annually from government funding (local, state, and federal). If this funding were eliminated, private foundations would need to increase their grantmaking by 282% to close the gap – an unlikely scenario.[xii] Moreover, philanthropy often overlooks rural and Tribal communities. Despite being home to 15-20% of the U.S. population, rural counties receive only 3% of annual philanthropic dollars,[xiii] while less than 0.5% of foundation funding supports Native American communities and causes.[xiv] Without federal support, the nonprofit services and programs these communities rely on would face cuts.
Impacts to Montana’s Workforce & Economy
Federal employment is a critical part of Montana’s workforce, employing 13,279 Montanans and contributing over $1.6 billion in earnings. The majority (62%) of Montana’s federal employees work in rural areas where job losses would have deep and lasting consequences. An additional 7,531 Montanans are employed by the military.[xv]
Job cuts to federal employment create cascading economic impacts. A reduced federal workforce leads to lower household spending, impacting local businesses such as restaurants, grocery stores, childcare providers, and service industries.
Job losses have long-term consequences. Ten years after job loss, workers tend to earn about 25% less compared to non-displaced peers.[xvi]
Montana’s local governments collectively receive an average of $361.3 million annually in federal contracts, grants, loans, and direct payments. The majority of this funding comes from the Department of Transportation, Department of the Treasury, Department of Education, and Department of Housing and Urban Development. [xvii]
Federal funding is particularly important for local governments in Montana with large amounts of public land. Montana’s county governments receive $43.3 million annually from Payments in Lieu of Taxes (PILT) to compensate for untaxable federal lands.[xviii] In 2024, the counties receiving the highest PILT payments were Flathead County ($3.8 million), Ravalli County ($3.3 million), Lewis & Clark County ($3.2 million), Missoula County ($2.8 million), Gallatin County ($2.3 million), and Park County ($2.0 million). Reductions in federal payments to local governments, such as PILT payments, without replacement revenue would destabilize local budgets and erode essential government services.
Montana’s 27.5 million acres of federal public lands are vital economic drivers, particularly for rural communities.[xix] In the Western U.S., rural counties with more federal land outperform their peers in population growth, employment, and income.[xx] Montana’s outdoor recreation economy generates $7.1 billion in consumer spending, contributes $286 million in state and local taxes, and supports 71,000 jobs.[xxi]
Budget cuts to federal land management agencies – such as the Forest Service, Bureau of Land Management, and the National Park Service – could reduce services, limit operational hours, and trigger substantial economic losses. In Montana, gateway communities such as Gardiner, Red Lodge, and Columbia Falls, which rely heavily on public lands and tourism, would be hit hardest.
Federal funding helps stabilize Montana’s agriculture sector, buffering it from price fluctuations, trade disruptions, and disasters. Montana’s 24,366 farms and ranches generate over $4.5 billion in sales annually and receive more than $575.3 million annually from government payments.[xxii] Federal funds provide stability through commodity programs (direct payments and loans), crop insurance, disaster relief, and conservation incentives.
Impacts on Individual Montanans
Montanans rely on federal funding for essential services that support daily life, from healthcare and housing to education and infrastructure. Cuts to federal programs could reduce access to Social Security, Medicare, Medicaid, veterans benefits, and food assistance, disproportionately affecting rural and low-income communities. Investments in disaster response, rural fire departments, and infrastructure—such as roads, bridges, and broadband—are also at risk, potentially increasing long-term costs for communities. As a state more reliant on federal funding than most, Montana faces outsized risks if federal budgets are cut.
The federal government has a legal obligation to provide services to Tribal nations under guaranteed treaty rights. From 2003 to 2009, federal funding for services, such as public safety, healthcare, and education made up over 58% of revenue (an average of $553.6 million per year) to Tribal governments in Montana.[xxiii] Over the same time period, tribal government spending contributed nearly $1 billion per year to Montana’s economy, supporting job creation, schools and Tribal colleges, healthcare, resource management, and business development on Tribal lands.[xxiv]Native Americans also serve in the military at rates five times the national average, making them particularly affected by reductions in veterans’ services and healthcare services.[xxv]
Social Security: In 2023, the federal government sent $443.8 million/month in Social Security benefits to Montanans.[xxvi] 89% of Montana counties are more reliant on Social Security benefits (as a percent of personal income) than the national average.[xxvii] A total of 156,515 Montana households receive Social Security, and 17,187 households receive Supplemental Security Income.[xxviii]
Medicare: In 2021, Montana received $1.6 billion in Medicare payments.[xxix] 86% of Montana counties are more reliant on Medicare (as a percent of personal income) than the national average. Medicare is the federal health insurance program for people age 65 or older. More than 262,000 Montana residents are enrolled in Medicare.[xxx]
Medicaid: Montana received $1.89 billion in Medicaid funding from the federal government in FY 2023, approximately 80% of the program’s total cost to the state.[xxxi]52% of Montana counties are more reliant on Medicaid (as a percent of personal income) than the national average. Medicaid is a joint federal-state program that covers medical costs for limited-income individuals. As of December 2024, more than 214,00 Montanans are enrolled in Medicaid and Montana’s Children’s Health Insurance Program.[xxxii]
Veterans Benefits: 89% of Montana counties are more reliant on veterans benefits (as a percent of personal income) than the national average. Lincoln County (3.4% of total income) and Sanders County (3.3%) have the highest rates.[xxxiii]
Food Assistance: Montanans received $169.5 million in SNAP benefits (formerly known as Food Stamps) in 2024.[xxxiv] 37,655 Montana households receive SNAP benefits [xxxv] and 13,400 Montana mothers, infants, and children receive nutrition assistance from the Women, Infants, and Children (WIC) program.[xxxvi] Budget cuts to either program could reduce access to services that provide critical support for food security.
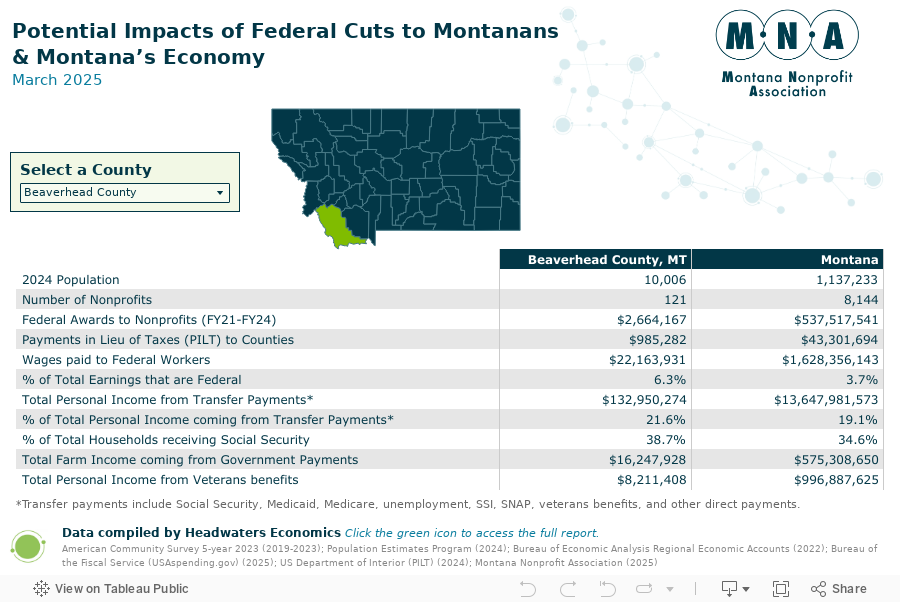
Visualize the Data by County
Click on the map or select a county in the dropdown to see county funding breakdowns.
Acknowledgments
This report was produced for Montana Nonprofit Association by Dr. Kristin Smith, Kelly Pohl, and Tara Preston of Headwaters Economics. Headwaters Economics is an independent, nonprofit research group whose mission is to improve community development and land management decisions. https://headwaterseconomics.org/
For more information, please contact Montana Nonprofit Association: https://mtnonprofit.org/.
Citations
[i] U.S. Department of the Treasury. (2025). USAspending.gov: Montana overview Bureau of the Fiscal Service, Washington, D.C. https://www.usaspending.gov. Obligated amount is for new prime awards in FY 2024, including direct payments, grants, contracts, loans, and other financial assistance.
[ii] Pew Charitable Trusts. (2024). Fiscal 50: Federal Share of State Revenue. https://www.pewtrusts.org/en/research-and-analysis/data-visualizations/2014/fiscal-50/federal-share-of-state-revenue
[iii] Rockefeller Institute of Government. (2022). Who gives and who gets? Explore the balance of payments between states and the federal government. https://rockinst.org/issue-areas/fiscal-analysis/balance-of-payments-portal/
[iv] Montana Legislative Fiscal Division. (2019). Federal Revenues in Montana. Helena, MT. https://archive.legmt.gov/content/Publications/fiscal/2021-Interim/Jan-2020/Federal-Funds-Risk-FINAL.pdf
[v] Montana Nonprofit Association. (2025). Montana nonprofit economic impact report. https://mtnonprofit.org/mna-resources/2025-economic-impact-report/.
[vi] Nonprofit Works. (2025.) Data Explorer. Fairfax, VA: George Mason University. https://gmu-nonprofit-works.org/
[vii] Poongundranar T, Lecy J, Tomasko L, Harrison T & Martin H. (2025). What is the Financial Risk of Nonprofits Losing Government Grants? Washington, DC: Urban Institute. https://www.urban.org/research/publication/what-financial-risk-nonprofits-losing-government-grants. Data include nonprofits in Montana that filed an IRS Form 990 and does not include 990EZ filers or 990N postcard filers. Dataset likely underestimates impacts as it does not include government contracts, fees, vouchers, or reimbursements.
[viii] Martin H, Boris ET, Tomasko L, Lecy J, Faulk L & Kim M. (2024). Nonprofit Trends and Impacts 2021-2023. Washington, DC: Urban Institute. https://www.urban.org/sites/default/files/2024-10/Nonprofit_Trends_and_Impacts_2021-2023_National_Findings_on_Government_Grants_and_Contracts.pdf
[ix] Poongundranar T, Lecy J, Tomasko L, Harrison T & Martin H. (2025). What is the Financial Risk of Nonprofits Losing Government Grants? Washington, DC: Urban Institute. https://www.urban.org/research/publication/what-financial-risk-nonprofits-losing-government-grants. Data include nonprofits in Montana that filed an IRS Form 990 and does not include 990EZ filers or 990N postcard filers. Dataset likely underestimates impacts as it does not include government contracts, fees, vouchers, or reimbursements.
[x] U.S. Department of the Treasury. (2025). USAspending.gov. Bureau of the Fiscal Service, Washington, D.C. https://www.usaspending.gov. Average amount includes new federal prime awards (contracts, contract IDVs, grants, direct payments, loans, and other) for nonprofits, foundations, and community development corporations for FY21-24.
[xi] ibid.
[xii] Clerkin C, Koob A, & Wolcheck D. (2025). How reliant are nonprofits on government grants? Candid. https://blog.candid.org/post/how-many-nonprofits-rely-on-government-grants-data/
[xiii] Sablik, T. (2024). The philanthropy gap in rural America. Federal Reserve Bank of Richmond, Richmond, VA. https://www.richmondfed.org/publications/research/econ_focus/2024/q4_feature2.
[xiv] Native Americans in Philanthropy. (2019). Investing in Native communities: Philanthropic funding for Native American communities and causes. Research conducted in collaboration with Candid. https://www.issuelab.org/resources/35493/35493.pdf?download=true&_ga=2.56827946.1209014558.1604941390-1531925363.1604941390.
[xv] U.S. Department of Commerce. (2022). Bureau of Economic Analysis, Regional Economic Accounts, Washington, D.C.
[xvi] Shiro AG and Butcher KF. (2022). The long-term economic scars of job displacements. Washington, DC: Brookings Institute. https://www.brookings.edu/articles/the-long-term-economic-scars-of-job-displacements/#_ftn1
[xvii] U.S. Department of the Treasury. (2025). USAspending.gov. Bureau of the Fiscal Service, Washington, D.C. https://www.usaspending.gov. Average amount includes new federal prime awards (contracts, contract IDVs, grants, direct payments, loans, and other) to Montana local governments for FY21-24.
[xviii] U.S. Department of Interior. (2025). Payment in Lieu of Taxes. Washington, DC. https://pilt.doi.gov/counties.cfm
[xix] U.S. Geological Survey. (2022). Gap Analysis Project. Protected Areas Database of the United States (PADUS) version 3.0. https://www.usgs.gov/programs/gap-analysis-project/tools
[xx] Lawson M. (2024). Public land ownership in the United States. Bozeman, MT: Headwaters Economics. https://headwaterseconomics.org/public-lands/protected-lands/public-land-ownership-in-the-us/
[xxi] Rasker R. (2019). The value of Montana’s outdoors. Bozeman, MT: Headwaters Economics. https://headwaterseconomics.org/economic-development/value-of-montanas-outdoors.
[xxii] U.S. Department of Agriculture. (2022). 2022 Census of Agriculture: Ranking of Market Value of Ag Products Sold – Montana. Washington, DC: USDA National Agricultural Statistics Service. https://www.nass.usda.gov/Publications/AgCensus/2022/Online_Resources/Rankings_of_Market_Value/market_value_30.pdf. Government payment data: U.S. Department of Commerce. (2023). Bureau of Economic Analysis, Regional Economic Accounts, Washington, D.C.
[xxiii] Montana Department of Commerce. (2017). Economic contributions of reservations to the State of Montana, 2003-2009. Helena, MT. https://archive.legmt.gov/content/Committees/Interim/2017-2018/State-Tribal-Relations/Meetings/Mar-2018/reap-report-2003-2009.pdf.
[xxiv] ibid.
[xxv] Ramirez, Alan. (2019). American Indian veterans have highest record of military service. National Indian Council on Aging, Inc. Albuquerque, NM. https://www.nicoa.org/american-indian-veterans-have-highest-record-of-military-service/
[xxvi] Social Security Administration. (2023). Congressional statistics, December 2023: Montana Social Security. https://www.ssa.gov/policy/docs/factsheets/cong_stats/2023/mt.html.
[xxvii] U.S. Department of Commerce. 2022. Bureau of Economic Analysis, Regional Economic Accounts, Washington, D.C.
[xxviii] U.S. Department of Commerce. 2023. Census Bureau, American Community Survey Office, Washington, D.C.
[xxix] Kaiser Family Foundation. (2021). State health facts: Total Medicare spending, 2021. https://www.kff.org/medicare/state-indicator/medicare-spending-by-residence.
[xxx] U.S. Centers for Medicare & Medicaid Services. (2024). Medicare monthly enrollment. Washington, D.C. https://data.cms.gov/summary-statistics-on-beneficiary-enrollment/medicare-and-medicaid-reports/medicare-monthly-enrollment.
[xxxi] Montana Healthcare Foundation. (2025). 2024 Medicaid in Montana: How Medicaid impacts Montana’s state budget, economy, and health. https://mthf.org/resource/2024-medicaid-in-montana/.
[xxxii] Montana DPHHS. (2024). Montana Medicaid enrollment dashboard. https://dphhs.mt.gov/InteractiveDashboards/medicaidenrollmentdashboard
[xxxiii] U.S. Department of Commerce. (2022). Bureau of Economic Analysis, Regional Economic Accounts, Washington, D.C.
[xxxiv] Center on Budget Policy and Policy Priorities. (2025). Montana: Supplemental Nutrition Assistance Program. https://www.cbpp.org/sites/default/files/atoms/files/snap_factsheet_montana.pdf
[xxxv] U.S. Department of Commerce. 2023. Census Bureau, American Community Survey Office, Washington, D.C.
[xxxvi] Montana DPHHS. (2024). DPHHS Improves Customer Service, Access to Women, Infants, and Children WIC) Program. https://dphhs.mt.gov/News/2024/December/WICProgram
Search by tag:
You May Also Like
March 20, 2025
There is a disturbing change of rhetoric taking place across our country and across Montana. …

January 28, 2025
Actions you can take now Let the National Council of Nonprofits know how this will…

January 28, 2025
Sent Tuesday, January 28 at 11:30 am. Information on the federal funding freeze is subject…